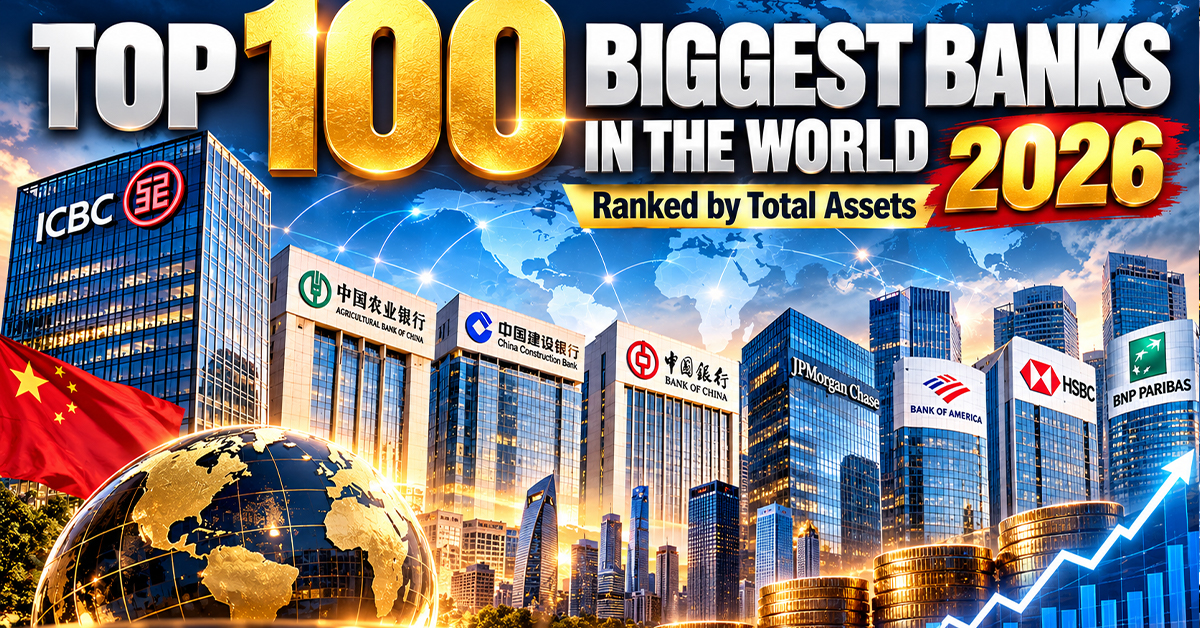
The biggest banks in the world in 2026 are dominated by a small group of financial institutions with enormous balance sheets. The Global Banker’s 2026 ranking lists 100 banking groups across 24 countries, with combined assets of about US$131.3 trillion based on FY2025 audited accounts.
The ranking is based on total assets, so it measures the size of each banking group rather than its profitability, capital strength or risk profile.
How the World’s Biggest Banks Are Ranked
The Global Banker ranks banking groups by consolidated total assets. Its 2026 edition uses FY2025 audited accounts and was published on September 25, 2026. Most institutions report a December 2025 year-end, although some banks use different financial years.
Figures are presented in U.S. dollars. This makes international comparison easier, but exchange rates and different reporting dates can affect the reported dollar value.
Top 100 Biggest Banks in the World
The complete ranking below uses The Global Banker dataset and is arranged from #100 to #1 for easy use as a countdown.
| Rank | Bank | Country | Total Assets (US$bn) |
|---|---|---|---|
| 100 | Industrial Bank of Korea | South Korea | 348.2 |
| 99 | State Street | United States | 366.0 |
| 98 | DNB Bank | Norway | 367.6 |
| 97 | Handelsbanken | Sweden | 368.4 |
| 96 | Desjardins Group | Canada | 372.6 |
| 95 | Macquarie Group | Australia | 373.8 |
| 94 | QNB Group | Qatar | 382.2 |
| 93 | First Abu Dhabi Bank | UAE | 382.3 |
| 92 | SEB | Sweden | 399.2 |
| 91 | Caixa Econômica Federal | Brazil | 406.0 |
| 90 | LBBW | Germany | 408.0 |
| 89 | National Bank of Canada | Canada | 412.6 |
| 88 | Woori Financial Group | South Korea | 418.3 |
| 87 | Bradesco | Brazil | 425.5 |
| 86 | Bank of Nanjing | China | 431.9 |
| 85 | Erste Group | Austria | 433.0 |
| 84 | UOB | Singapore | 445.6 |
| 83 | Banco do Brasil | Brazil | 448.3 |
| 82 | KBC Group | Belgium | 466.8 |
| 81 | Hana Financial Group | South Korea | 469.1 |
| 80 | BNY | United States | 472.3 |
| 79 | Bank of Shanghai | China | 472.9 |
| 78 | Resona Holdings | Japan | 481.1 |
| 77 | ABN AMRO | Netherlands | 485.4 |
| 76 | China Zheshang Bank | China | 497.6 |
| 75 | Nationwide Building Society | United Kingdom | 506.3 |
| 74 | Sumitomo Mitsui Trust Group | Japan | 518.2 |
| 73 | Bank of Ningbo | China | 518.7 |
| 72 | HDFC Bank | India | 525.0 |
| 71 | OCBC | Singapore | 526.3 |
| 70 | Norinchukin Bank | Japan | 528.8 |
| 69 | China Guangfa Bank | China | 533.4 |
| 68 | Shinhan Financial Group | South Korea | 546.6 |
| 67 | Truist Financial | United States | 547.5 |
| 66 | KB Financial Group | South Korea | 554.9 |
| 65 | Itaú Unibanco | Brazil | 559.9 |
| 64 | PNC Financial Services | United States | 573.6 |
| 63 | Danske Bank | Denmark | 590.4 |
| 62 | Capital One | United States | 669.0 |
| 61 | Huaxia Bank | China | 677.2 |
| 60 | U.S. Bancorp | United States | 692.3 |
| 59 | Commerzbank | Germany | 693.2 |
| 58 | DBS Group | Singapore | 699.0 |
| 57 | Bank of Jiangsu | China | 704.9 |
| 56 | Bank of Beijing | China | 705.9 |
| 55 | National Australia Bank | Australia | 733.2 |
| 54 | Westpac | Australia | 743.9 |
| 53 | Rabobank | Netherlands | 750.5 |
| 52 | Nordea | Finland | 768.7 |
| 51 | DZ BANK Group | Germany | 777.0 |
| 50 | CaixaBank | Spain | 780.1 |
| 49 | CIBC | Canada | 798.9 |
| 48 | Ping An Bank | China | 847.0 |
| 47 | La Banque Postale | France | 852.2 |
| 46 | ANZ Group | Australia | 857.5 |
| 45 | State Bank of India | India | 890.2 |
| 44 | Commonwealth Bank of Australia | Australia | 890.5 |
| 43 | Standard Chartered | United Kingdom | 920.0 |
| 42 | NatWest Group | United Kingdom | 962.3 |
| 41 | BBVA | Spain | 1,009.8 |
| 40 | UniCredit | Italy | 1,022.3 |
| 39 | China Everbright Bank | China | 1,024.2 |
| 38 | Scotiabank | Canada | 1,044.3 |
| 37 | Bank of Montreal | Canada | 1,056.3 |
| 36 | China Minsheng Bank | China | 1,119.6 |
| 35 | Intesa Sanpaolo | Italy | 1,127.6 |
| 34 | ING Group | Netherlands | 1,238.6 |
| 33 | Lloyds Banking Group | United Kingdom | 1,271.4 |
| 32 | Crédit Mutuel Group | France | 1,402.8 |
| 31 | Morgan Stanley | United States | 1,420.3 |
| 30 | Japan Post Bank | Japan | 1,428.8 |
| 29 | Shanghai Pudong Development Bank | China | 1,441.1 |
| 28 | China CITIC Bank | China | 1,448.1 |
| 27 | Toronto-Dominion Bank | Canada | 1,498.1 |
| 26 | Industrial Bank | China | 1,585.8 |
| 25 | UBS Group | Switzerland | 1,617.4 |
| 24 | Royal Bank of Canada | Canada | 1,663.0 |
| 23 | Deutsche Bank | Germany | 1,685.8 |
| 22 | Goldman Sachs | United States | 1,809.3 |
| 21 | Société Générale | France | 1,816.9 |
| 20 | China Merchants Bank | China | 1,868.3 |
| 19 | Mizuho Financial Group | Japan | 1,905.9 |
| 18 | Groupe BPCE | France | 1,933.3 |
| 17 | Sumitomo Mitsui Financial Group | Japan | 2,071.6 |
| 16 | Barclays | United Kingdom | 2,079.6 |
| 15 | Wells Fargo | United States | 2,148.6 |
| 14 | Banco Santander | Spain | 2,193.8 |
| 13 | Bank of Communications | China | 2,222.4 |
| 12 | Citigroup | United States | 2,657.2 |
| 11 | Postal Savings Bank of China | China | 2,670.4 |
| 10 | Mitsubishi UFJ Financial Group | Japan | 2,722.5 |
| 9 | Crédit Agricole Group | France | 3,150.5 |
| 8 | HSBC Holdings | United Kingdom | 3,233.0 |
| 7 | BNP Paribas | France | 3,281.0 |
| 6 | Bank of America | United States | 3,411.7 |
| 5 | JPMorgan Chase | United States | 4,424.9 |
| 4 | Bank of China | China | 5,482.8 |
| 3 | China Construction Bank | China | 6,522.5 |
| 2 | Agricultural Bank of China | China | 6,973.1 |
| 1 | ICBC | China | 7,643.9 |
Source: The Global Banker, 2026 edition. Total assets are shown in US$ billions.
China Leads the Global Ranking
China has 21 banks in the Global Banker Top 100, the largest national representation. Chinese banks account for about 35% of the combined assets of the 100 banks in the ranking.
The country’s four largest banking groups occupy the first four positions: ICBC, Agricultural Bank of China, China Construction Bank and Bank of China. ICBC leads with US$7.64 trillion in assets.
The United States follows with 12 banks in the S&P Global 2026 ranking, while Japan has eight and the UK, France and Canada each have six.
Why Rankings Can Differ
Different financial databases can produce slightly different rankings because their methodologies are not identical.
For example, S&P Global’s 2026 ranking also places ICBC first, with US$7.646 trillion in assets, and places China’s other three major state-backed banks immediately behind it. However, S&P says it made best-efforts adjustments for certain mergers, acquisitions and divestitures and converted non-U.S.-dollar figures using period-end exchange rates.
For that reason, this article consistently uses The Global Banker ranking rather than mixing values from the two methodologies.
What Readers Should Know
- ICBC is #1 in The Global Banker’s 2026 ranking, with US$7.6439 trillion in total assets.
- China’s Big Four occupy the top four positions, showing the extraordinary scale of China’s largest banking groups.
- Total assets measure size, not overall financial strength; profitability, capital ratios and risk require separate analysis. The Global Banker itself publishes capital and profitability measures alongside its asset ranking.
Conclusion
The 2026 global banking ranking shows how concentrated the world’s largest balance sheets remain among a relatively small number of institutions. ICBC leads the list, followed by three other Chinese banking groups, while JPMorgan Chase is the highest-ranked U.S. bank at #5 and BNP Paribas is the highest-ranked European bank at #7.
The ranking is most useful as a measure of banking scale. It should not, by itself, be interpreted as a ranking of the safest, most profitable or strongest banks.